About the data
Every blanket on this site is drawn from a real weather station's daily record. Here is which stations, and how the numbers are made.
The weather
Daily maximum and minimum temperatures come from NOAA's National Centers for Environmental Information: the Global Historical Climatology Network daily summaries, in degrees Fahrenheit. The current year is updated as NOAA posts each day; the latest reading here is from 2026-10-18.
Which station is your city
Each of the 200 largest US cities (by the Census Bureau's 2023 estimates) is matched to one first-order weather station, the kind run at airports and weather offices with long, checked records. For the 22 largest cities we use the station the National Weather Service reports as the city's official record, such as Central Park for New York and O'Hare for Chicago. For the rest we use the nearest station with a full record. Each blanket page names its station.
A year is drawn only when the station reported at least 97% of its days. Days with no reading are listed on the page and left out of the blanket rather than guessed.
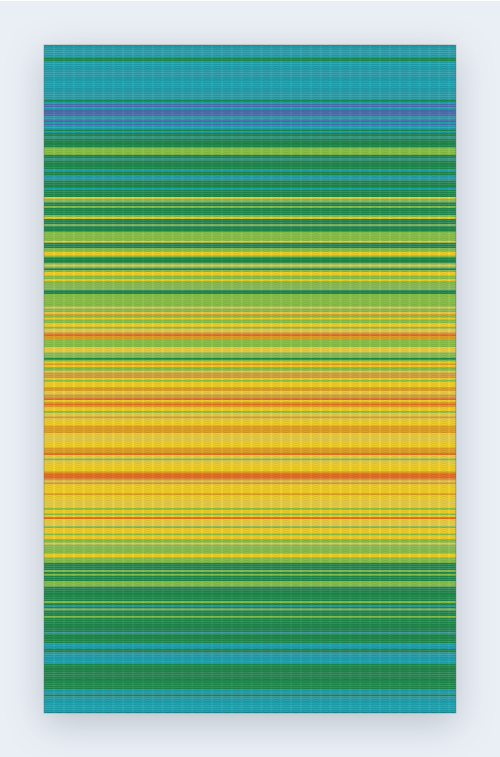
The colors
Ten bands of 10°F, from below 20°F to 100°F and up, colored by each day's high. The bands are the same in every city so the blankets can be compared.
The yarn
Worsted weight at a typical gauge, with 10% extra on every color, rounded up to whole skeins or packs. Yarn links go to Amazon; as an Amazon Associate we earn from qualifying purchases, at no extra cost to you.
Yarn Forecast is run by GTMFM.NO. Write to us to add a city or to report a number that looks wrong.